
Utilities & Urban Water
The utilities that supply the region's fast-growing cities: networks, non-revenue water, service quality, demand management and industrial supply.
Why it matters
The MENA region is one of the most urbanised places on earth. Roughly seven in ten people live in cities, and the cities keep growing faster than their pipes. Urban systems carry the region's hardest water job: delivering a daily service from a scarce, distant resource, through networks that leak, to customers who often pay less than the water costs. When water stress becomes news, it is usually urban: rationing in Amman, outages in Damascus, taps run dry in Basra's summer.
The global arithmetic is stark. Utilities lose about 346 million m³ of water every day, or 126 billion m³ a year, conservatively worth US$39 billion. Several of the world's highest national loss rates are in this region. Dubai, at the other extreme, publishes about 4.5%, among the lowest figures any large utility reports.40
State of the region
Performance spans the full global range. At one end, Gulf utilities run world-class networks: Dubai's DEWA reports distribution losses around 5%, among the lowest anywhere, with near-universal smart metering. At the other end, intermittent supply is normal. Amman distributes by rota, roughly weekly, while Algiers and Tripoli cycle by district and conflict cities rebuild networks between outages. In between, giants like Cairo and Riyadh pour capital into treatment and transmission while chasing losses through their distribution mazes. Saudi planning figures put national water losses at 33% in 2025, against a target of about 15% by 2031.42 A KAPSARC paper cites Riyadh data showing 34% non-revenue water, 21 points physical and 13 commercial.43 Refugee inflows, from Syrians in Jordan and Lebanon to displaced Iraqis and Yemenis, compress a decade of demand growth into a few years.
How urban the region is
Urban share of population, selected countries (%)
World Bank World Development Indicators, latest available.
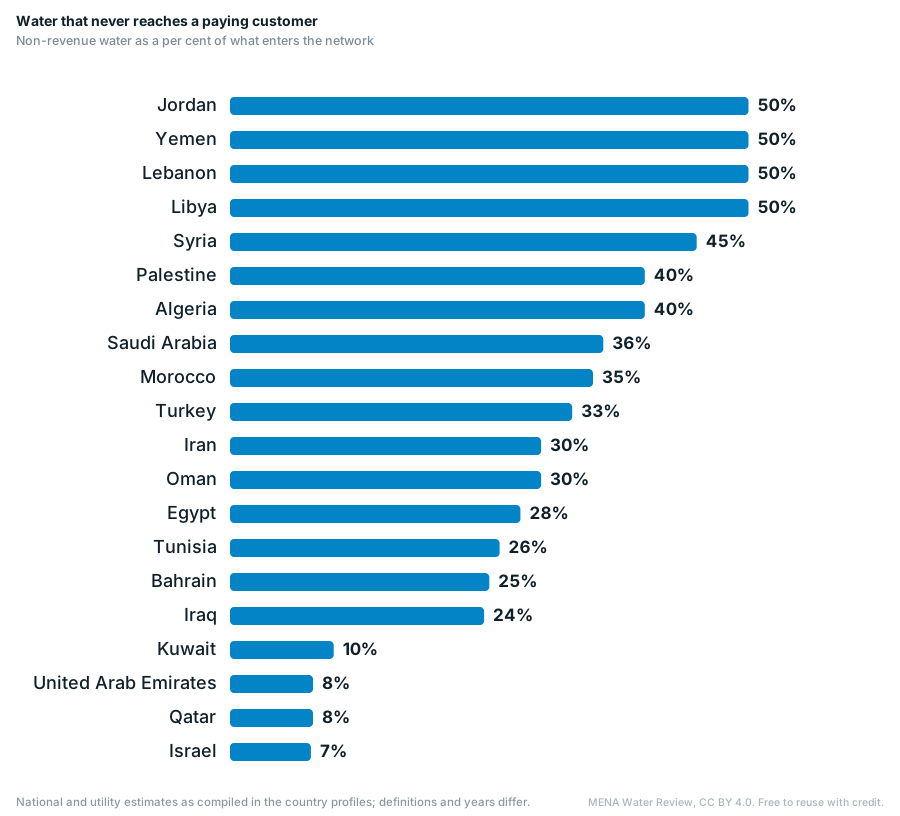
Water that never reaches a paying customer
Non-revenue water as a per cent of what enters the network
National and utility estimates as compiled in the country profiles; definitions and years differ.
Reading a loss figure without being misled by it
Why the percentage is the wrong comparator
Non-revenue water is a ratio to the volume put into supply, and that volume depends on supply hours, pressure and demand. None of those are comparable between a rationed city and a continuously pressurised one.
A World Bank paper co-authored by Roland Liemberger works the example: identical physical leakage reads as 20% under intermittent supply and 29% under continuous. A utility can therefore improve its network and watch its headline number rise.
Amman: 44.7%, and falling on every volumetric measure
Miyahuna reported 44.7% in 2023. Its network is pressurised 22.6% of the time and 1.2% of subscribers receive continuous supply, so most households store water in roof tanks.
The volumetric series tells the opposite story to the headline. Loss per connection fell from 1.25 to 0.99 cubic metres a day between 2019 and 2023, and loss per kilometre of main from 25.5 to 23.5. The 2023 rise in the percentage was the Balqa merger: excluding Balqa, whose own losses ran at 62.2%, Miyahuna was at 38.9%.
Dubai: 4.5%, and not fully auditable
DEWA reported 4.5% in 2024 and 4.4% in 2025, among the lowest figures published anywhere. The structural advantages behind it are a young network, continuous pressure and near-total metering, none of which is a management choice a Jordanian utility could copy.
The figure also does not fully reconcile. DEWA publishes no water balance and no definition of what its loss figure covers, and its own statistics booklets imply gaps of 8.1% in 2023 and 8.5% in 2024 against those headlines.
Why donor programmes have struggled here
More than JOD 1.28 billion has been committed to non-revenue water in Jordan alone. An EU-funded policy review in May 2024 tabulated the results: a KfW programme of EUR 18.8 million in Karak with no impact and a post-evaluation reporting an increase in losses, a EUR 28.5 million programme in the north with little impact, and a USAID programme of USD 42.5 million whose gains were not sustained because operations staff breached the zonal boundaries the scheme depended on.
The zone breach is the transferable lesson. District metering only works if operators respect the districts, and during a shortage the incentive to open a valve beats the incentive to protect a measurement.
What to ask for instead
Losses per connection per day, or per kilometre of main, survive comparison between systems where a percentage does not. On that basis the gap between these two cities is wider than the headline suggests, not narrower: roughly 77 litres per account per day in Dubai against about 990 measured in Amman.
Case study
One scheme in this sector, examined in full: what was built, what it cost, what worked and what did not.
Interactive dashboard
The hub's headline metric for all twenty countries. Hover, tap or focus a country; the ranked table sits alongside.
Enable JavaScript to load the dashboard.
Service & drinking-water quality
What comes out of the tap is a utility performance question as much as a resource question. Across the region, the water leaving a treatment works is usually compliant. The risk sits between there and the kitchen: intermittent supply, pressure loss, contaminated storage tanks and ageing pipe.
Intermittent supply is the core problem. When a network is pressurised only a few hours a week, pipes depressurise between cycles, and groundwater and sewage are drawn in through joints and cracks. That is still normal in much of Iraq, Yemen and Syria, and in parts of Jordan and Lebanon. Households then store water in rooftop tanks that are rarely cleaned. Continuous pressurisation is therefore one of the highest-value public-health interventions a utility can make, quite apart from what it does for losses.
Basra, 2018
Roughly 118,000 people were hospitalised in a single summer after salinity and contamination in the Shatt al-Arab overwhelmed a degraded network, the region's clearest demonstration that water quality is a service-delivery failure, not just a resource failure.
Cholera and unsewered growth
Where piped supply and sanitation have not kept pace with urban expansion, waterborne disease follows. Yemen's outbreak from 2016, the largest recorded in modern times, is the extreme case of a network that stopped being able to run.
Bottled-water substitution
Where confidence in tap water collapses, households switch to bottled and tankered water at many times the price. This is a hidden regressive tax on poor households and a lost revenue base for the utility.
Salinity and aquifer contamination are covered in the Groundwater & Aquifers hub; treatment standards and discharge limits in Wastewater & Water Reuse.
Industrial water
Industry is a small share of regional withdrawals, typically a few per cent, but a disproportionate share of the water market. Industrial users pay something close to the real cost, and they buy engineering rather than subsidy.
Oil and gas is the largest of these demands. It generates produced water at scale and needs injection water to maintain reservoir pressure, so treatment, reinjection and disposal are a standing business across the Gulf, Iraq and Algeria. Iraq's Common Seawater Supply Project exists precisely to substitute seawater for fresh water in oil-field injection. Power generation is the second: plants need cooling water, which is why they cluster on the coast and why water and electricity procurement are joined. The third is the industrial cities, Jubail, Yanbu, Sohar and Ain Sokhna, which run dedicated water and effluent systems, increasingly fed by treated wastewater rather than desalinated supply.
The commercial direction of travel is toward reuse. Industrial users are the natural first customers for treated effluent, since they need volume and reliability rather than potable quality, and they can sign a bankable offtake.
Urban flooding & flood protection
Water scarcity dominates the region’s reputation, but floods are its most frequent disaster. The World Bank counted 213 floods in 15 countries between 1900 and 2011, killing almost 19,000 people.1 Flash flooding is rising in cities across the region. Over the decade before 2014 the number of flash floods, and of people affected or killed, doubled.1 The Bank blames mainly concrete surfaces that cannot absorb water, poor drainage and building in low-lying areas.1
Why desert cities flood
Many cities are built across the paths that storm water has always taken. In Jeddah, runoff from the eastern hills reaches the Red Sea through wadis that are now urban districts. Slums and construction in the valleys made the floods worse.2 In Algiers in 2001, relief officials pointed to the city’s steep terrain, dense population and overbuilt stream beds.3 Sprawl onto alluvial channels cuts infiltration and raises flood peaks, even in short, light rain.4 Standard design methods can also underestimate the risk. In Muscat’s Wadi Aday, regional curve numbers gave peak flows on average 19% higher than the standard approach.5 Most of the region still lacks comprehensive protection from wadi flash floods, and single structures such as dams and embankments remain the norm.6
The climate is adding pressure. The IPCC reports an observed increase in extreme precipitation across south-west Asia, mostly in elevated areas.7 WMO’s first report on the Arab region found 2024 the hottest year on record there, with more extreme rainfall and storms accompanying the warming.8 A 2025 study found the April 2024 UAE storm was made worse by human-caused warming and by changes in land use.9
The record
Death tolls often differ between sources and change as searches continue. The table gives the range reported, not a single number.
| Event | Year | Deaths reported |
|---|---|---|
| Algiers, Bab El Oued flash flood | 2001 | 651 in Bab El Oued to more than 90031 |
| Cyclone Gonu, Oman | 2007 | at least 49, with more than 24 missing, by 10 June10 |
| Hadramawt and Al-Mahra floods, Yemen | 2008 | 73 to 1801112 |
| Jeddah flash flood, Saudi Arabia | 2009 | 1132 |
| Iran floods, including Shiraz | 2019 | 70 by 7 April13 |
| Cyclone Shaheen, Oman | 2021 | 11 to 12 in Oman1415 |
| Storm Daniel, Derna, Libya | 2023 | almost 4,000 by 19 September16 |
| April storms, UAE and Oman | 2024 | 20 in Oman, 4 in the UAE9 |
| Tata and the south-east, Morocco | 2024 | at least 1817 |
| Safi flash flood, Morocco | 2025 | 21 to 371819 |
| Moknine, Tunisia | 2026 | 420 |
The April 2024 storm showed what a modern Gulf city faces. More than 142 mm fell on Dubai in 24 hours, against an average of 94.7 mm a year at the airport.21 Dubai International cancelled 1,244 flights over two days.22 Insured losses were estimated at US$2.9–3.4 billion, and property insurance rates rose by 15%.9 Smaller Gulf cities have been caught out too. Doha received 136 mm in under three weeks in 2018, against an annual average of about 75 mm.23 Kuwait had 98 mm in two days that November, and flooding submerged passages at the airport.24
A year of rain, or more, in days
Rainfall in the event against a normal year or month, mm
Sources: Al Jazeera (Dubai, 17 April 2024; Doha, 12 November 2018; Kuwait, 15 November 2018).
North Africa’s recent floods have exposed drainage as well as rainfall. In September 2024 floods in south-east Morocco killed at least 18 people, most of them in Tata.17 In December 2025 about an hour of heavy rain flooded at least 70 homes and businesses in Safi’s old city.25 Prosecutors opened an investigation, and officials examined whether inadequate drainage made the flooding worse.26 In February 2026 rain and releases from overfilled dams forced the evacuation of 143,164 people in north-west Morocco.27 Tunisia had its heaviest rain in more than 70 years in January 2026, with 206 mm at Sidi Bou Said.20
Flood protection
Dubai has made the largest single commitment. In June 2024, two months after the storm, it approved Tasreef, an AED30 billion programme to raise rainwater drainage capacity by 700% across the emirate.28 The network is to be completed in stages by 2033.29 Contracts worth Dh1.44 billion in April 2025 added more than 36 km of drainage lines linked to the main tunnel.30 A second round worth Dh2.5 billion, covering 30 areas, followed in February 2026.31 Neighbourhood schemes are landing too. The first phase of a Dh500 million project in Al Quoz was completed in April 2026.32 Abu Dhabi approved updated stormwater drainage guidelines in 2022.33
Elsewhere, dams and development-bank programmes carry the load. Oman has seven flood protection dams with a combined capacity of 247.73 million m³, and its current plan adds 33 dams, including flood protection dams such as Al Khoudh in Muscat.34 In Taiz, a World Bank-financed project made major parts of the city, including downtown, secure against flash floods.1 Morocco’s integrated disaster risk programme with the World Bank began with US$200 million in 2016.35 A US$275 million loan with a catastrophe drawdown option followed in 2019.36 After the 2024 floods Morocco launched a MAD 2.5 billion rehabilitation programme for 12 provinces.17 Tunisia’s US$50 million resilience programme, approved in 2021, funds physical works to cut urban flood risk.37
Warning before the water
Soft measures such as early warning systems are still uncommon in wadi flood management across the region.6 Derna showed the cost. Libya’s warnings covered heavy rain and floods but not the risk from the ageing dams, and WMO called for multi-hazard warnings as a result.38 Experts surveyed in Jeddah ranked river management and early warning as the most favoured measures.39 For utilities and contractors, stormwater is becoming a procurement line of its own, from Dubai’s tunnel contracts to the drainage works in World Bank programmes.
Market map
Tracked urban water works: networks, metering and city-supply schemes.
Projects & tenders
The tracked projects in this sector and the structured procurements coming next, straight from our databases.
Projects
How the deals are structured
Urban water is where utility reform meets private contracts: management and performance contracts (NRW programmes in Amman and Saudi NWC's city clusters), corporatised utilities with regulated tariffs (Morocco's régies, Jordan's Miyahuna, Oman's Nama), and full concessions in a few markets (Casablanca's historic concession; Egypt's new PPP wave for treatment). Reference cases:
Amman, Jordan
A city of about 4.7 million on weekly rationing, held together by pressure management, the Disi baseload and a performance contract now being structured with IFC. The Aqaba to Amman carrier would add 300 million cubic metres a year.
Dubai, UAE
The efficiency benchmark at about 4.5% losses, with universal smart metering, demand tariffs and district cooling on treated effluent. The figure is real and the structural advantages behind it are not transferable.
Greater Cairo, Egypt
Twenty million customers and more, with mega-treatment works on both banks and a rolling programme of network extensions. Scale as its own engineering discipline.
Technologies & approaches
- Smart (AMI) metering and customer analytics: the Gulf standard, spreading to the Levant
- District metered areas + pressure management for intermittent-to-continuous conversion
- Acoustic and satellite leak detection on trunk and distribution mains
- Demand management: tariffs, retrofits, greywater and efficient fixtures
- Stormwater and flash-flood drainage (Jeddah's post-2009 programme)
- Digital twins and SCADA for whole-city operations
Standards & regulation
The urban service rulebook:
| Regulation | Status | Year | Note |
|---|---|---|---|
| WHO Guidelines for Drinking-water Quality | In force | 2022 | Tap-water safety benchmark. |
| ISO 24510/24512 (service to users / utility management) | In force | 2007 | Utility service-quality frameworks. |
| National tariff regulations | Under reform | — | Cost-recovery reforms in Jordan, Egypt, Morocco, Saudi Arabia. |
| Building codes & efficiency labels | In force | — | Fixture standards increasingly mandatory in the Gulf. |
Indicative; service standards are set nationally.
Economics
Urban water's core economic problem is the gap between the cost of the next cubic metre, desalinated and then pumped uphill, and tariffs set for social protection. The gap is closed by subsidy, by cross-subsidy from industry, or by losses. Increasingly it is closed by making the existing metre go further. A utility that cuts losses from 40% to 20% has built itself a new desalination plant for a tenth of the price. That arithmetic is the business case behind every NRW and metering programme in this hub.
Who to know
The bodies that commission, regulate or deliver in this sector, and the names that recur across its tenders.
- National Water Company (NWC)Utility · Saudi Arabia
- MiyahunaUtility · Jordan
- Dubai Electricity & Water Authority (DEWA)Utility · United Arab Emirates
- Environment Agency – Abu Dhabi (EAD)Environment · United Arab Emirates
- Holding Company for Water & Wastewater (HCWW)Utility · Egypt
- VeoliaDeveloper / operator · Regional
- SUEZDeveloper / operator · Regional
Mandates, procurement routes and the rest of the region’s institutions are in the decision-maker directory.
Business opportunities
Where the near-term money is:
Smart-metering rollouts
national programmes in Saudi Arabia and the Gulf, city programmes from Amman to Casablanca.
Continuous-supply conversion
DMA design, pressure management and network rehab in rationed cities.
Utility performance partnerships
operations support and KPI-based contracts as corporatisation spreads.
Urban stormwater
flash-flood drainage and green infrastructure after a decade of deadly floods.
Customer-side efficiency
retrofit programmes, greywater systems and smart-home water tech in the Gulf.
Outlook
Urban demand keeps compounding through population, refugees and heat, while the marginal source of supply moves offshore. The cities that manage will be the ones that treat the network itself as the resource: measured, pressurised, digital and priced honestly. That template already runs in the Gulf.
Further reading
Standing references for this sector. Every one is a real work and every link was checked.
- International Water Association, the professional body behind the water-balance and non-revenue water methodology utilities report against. iwa-network.org
- World Health Organization, Guidelines for Drinking-water Quality, fourth edition with addenda (2022). who.int
- FAO AQUASTAT, the standing database of national water resources, withdrawals and irrigated area. The denominator behind most figures on this site. fao.org
Sources
48 references
- World Bank (2014), Natural Disasters in the Middle East and North Africa: A Regional Overview.
- Youssef et al. (2015), Geomatics, Natural Hazards and Risk, doi:10.1080/19475705.2015.1012750.
- USAID/OFDA, Algeria floods fact sheet #1, FY02, 30 November 2001.
- Urbanisation and wadi flood hydrology, Hydrology Research 47(6) (2016), doi:10.2166/nh.2016.133.
- Wadi Aday runoff study, Urban Water Journal (2013), doi:10.1080/1573062x.2013.857420.
- Sumi et al. (eds.) (2021), Wadi Flash Floods, chapter 1, Springer, doi:10.1007/978-981-16-2904-4_1.
- IPCC AR6 WGI, Regional fact sheet: Asia.
- WMO, “Temperature increase is accelerating in Arab Region, with escalating impacts”, 4 December 2025.
- “From cause to consequence: examining the historic April 2024 rainstorm in the United Arab Emirates through the lens of climate change”, npj Climate and Atmospheric Science 8: 183 (2025).
- Gulf News, “Gonu death toll now 70”, 10 June 2007.
- UN Consolidated Appeals Process, Yemen Floods Response Plan 2008.
- WHO, heavy flooding in Yemen, situation report no. 4, 29 October 2008.
- ECHO, Iran floods, ECHO daily flash, 7 April 2019.
- Gulf News, report on Cyclone Shaheen deaths in Oman, 4 October 2021.
- AP, report on Cyclone Shaheen, 7 October 2021 (archived).
- OCHA, Libya flood update, flash update no. 5, 19 September 2023.
- Morocco World News, report on Morocco’s rehabilitation programme for flood-affected areas, 26 September 2024.
- Gulf News (AFP), “Flash floods kill 21 in Moroccan coastal town”, 15 December 2025.
- AP, report on the Safi floods, 15 December 2025 (archived).
- Al Jazeera, “Four killed by floods after Tunisia’s worst rainfall in 70 years”, 20 January 2026.
- Al Jazeera, report on Dubai’s record rainfall, 17 April 2024.
- Gulf News, explainer on the UAE’s heaviest rains, April 2024.
- Al Jazeera, “Why is it raining so much in Qatar this season?”, 12 November 2018.
- Al Jazeera, report on Kuwait flights resuming after flooding, 15 November 2018.
- Al Jazeera, report on the Safi flash floods, 15 December 2025.
- Al Jazeera, report on Morocco’s emergency relief after the floods, 17 December 2025.
- AP, report on flood evacuations in Morocco, 5 February 2026 (archived).
- Government of Dubai Media Office, approval of the AED30 billion Tasreef project, 24 June 2024.
- Gulf News, report on the Dh30 billion rainwater drainage project, 24 June 2024.
- Khaleej Times, report on Tasreef stormwater contracts, 13 April 2025.
- Gulf News, report on Dh2.5 billion stormwater contracts, 26 February 2026.
- The National, report on the Al Quoz stormwater project, 12 April 2026.
- Gulf News, report on Abu Dhabi’s stormwater drainage guidelines, 29 July 2022.
- Muscat Daily, “33 new dams to strengthen water security”, 11 July 2026.
- World Bank, Morocco Integrated Disaster Risk Management and Resilience Program (P144539).
- World Bank, Morocco Disaster Risk Management Development Policy Loan with a Cat DDO (P168580).
- World Bank, Tunisia Integrated Disaster Resilience Program (P173568).
- WMO, “Libya floods show need for multi-hazard early warnings and unified response”, 14 September 2023.
- Jeddah flood-management expert survey, Hydrology 7(1): 10 (2020), doi:10.3390/hydrology7010010.
- Liemberger, R. & Wyatt, A. (2019), “Quantifying the global non-revenue water problem”, Water Supply 19(3): 346 million m³/day lost worldwide, about US$39 bn/year at US$0.31/m³; DEWA reports 4.5% network losses, the lowest of any large utility.
- ADB and Global Water Partnership case studies of the Phnom Penh Water Supply Authority: non-revenue water cut from 72% (1993) to 6%, with 99.9% collection — the reference case for governance-led turnaround.
- SHARAKAT (Saudi Water Partnership Company), 7 Year Statement 2025–2031, Planning Division, March 2026, citing the Ministry of Environment, Water and Agriculture.
- Javid, M., Peszko, G. and Hasanov, F., KAPSARC, “The Cost of Water in a Desert: How Much Can Saudi Arabia Save From Water Loss Reduction?”, 9 December 2025.
- FAO, AQUASTAT — Global Information System on Water and Agriculture: country water resources, withdrawals by sector and dam register. fao.org/aquastat. Latest country values as compiled at build.
- World Bank, World Development Indicators and country water-sector reporting. data.worldbank.org.
- Kaufmann & Kraay, Worldwide Governance Indicators (World Bank), 2024 update — political-stability and regulatory-quality scores, 0–100, shown in the market snapshot. worldbank.org/wgi.
- World Resources Institute, Aqueduct 4.0 Water Risk Atlas (2023) — the sub-basin risk, stress and groundwater-decline layers on the interactive maps. wri.org/aqueduct.
- MENA Water Review major projects register and PPP pipeline — compiled from procurer publications, development-bank project pages and trade reporting; each record names its source.
Numbered references are linked from the superscript markers in the text. Figures without a marker come from the sources above as compiled in the site methodology.
Latest intelligence
Partnership
Partner with the Utilities & Urban Water hub
One organisation can sponsor this hub: your name and logo on the page, a profile in the organization directory, and first sight of the research we publish here. We take one partner per hub and we say who they are.