
Groundwater & Aquifers
The region's largest and least visible water resource: fossil aquifers, falling water tables, salinity and the recharge schemes trying to slow the decline.
Why it matters
Groundwater is the region’s largest water resource and its least visible. It is the most relied-upon source in at least 11 of the 22 Arab states, and more than 80% of freshwater withdrawals in Libya, Djibouti, Saudi Arabia and Palestine.4 Unlike a river, nobody can see it. Unlike a reservoir, nobody can easily measure what is left.
The satellite record puts hard numbers on the decline. NASA’s GRACE mission measured 143.6 km³ of fresh water lost across the Tigris and Euphrates basin and western Iran in the seven years from 2003 to 2009, nearly a Dead Sea’s worth. Roughly two-thirds of it, 91.3 ± 10.9 km³, came out of groundwater, at 17.3 ± 2.1 mm a year of equivalent water height against a total storage loss of 27.2 ± 0.6 mm a year.1 It remains the clearest single measurement of a region spending its buffer.
Much of this water is not renewable on any human timeframe. The Nubian sandstone was filled in the Pleistocene, and its recharge today is described as effectively zero, so pumping it is closer to mining than to harvesting.28 Saudi fossil water in the north is about 20,000 years old, and rainfall of 100 to 200 mm a year does not replace it.27 For the Gulf states as a group, depletion of non-renewable groundwater has been estimated at 317% of the renewable volume.4
The renewable aquifers, the coastal and alluvial systems, are usually being drawn down faster than rainfall replaces them, which pulls seawater inland and pushes salinity up. The Arabian Aquifer System sits among the most overstressed on earth on the GRACE-based stress ratios, though the same study puts the Murzuk, North Western Sahara and Nubian systems above it, so the superlative belongs to the group rather than to one aquifer.2
For companies and lenders, this is a market defined by measurement and remediation. It covers drilling and well-field rehabilitation, monitoring and metering, managed recharge, brackish desalination, and the modelling work behind every abstraction licence and transboundary negotiation.
State of the region
Four systems dominate the map. The Nubian Sandstone Aquifer System, among the largest bodies of fresh water on earth, underlies Egypt, Libya, Sudan and Chad and feeds Libya’s Great Man-Made River. The North Western Sahara Aquifer System, NWSAS in English and SASS in the French literature, is shared by Algeria, Tunisia and Libya. The Saq and Ram sandstone, known in Jordan as Disi, runs under Saudi Arabia and Jordan and supplies Amman through a 325 km conveyor. The Umm er Radhuma and Dammam limestones stretch beneath most of the Gulf peninsula, and the regional inventory maps them as three separate sections rather than one.8
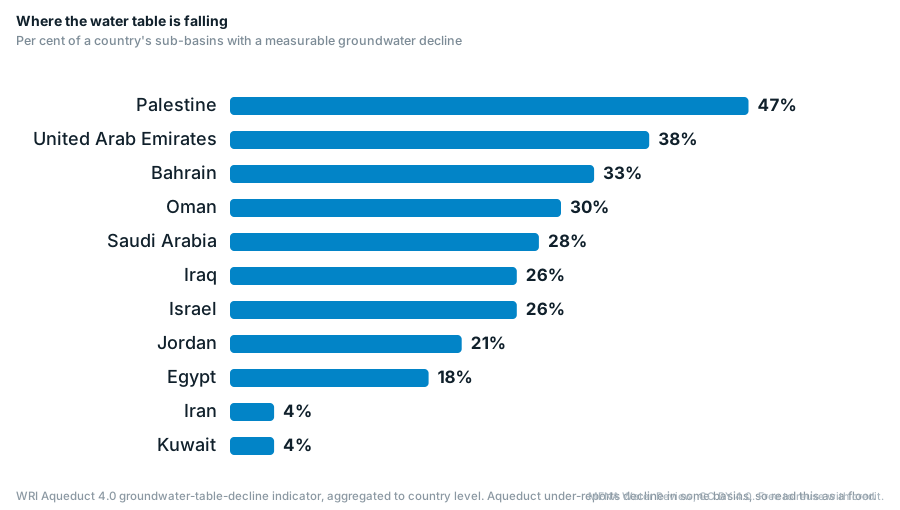
Where the water table is falling
Per cent of a country's sub-basins with a measurable groundwater decline
WRI Aqueduct 4.0 groundwater-table-decline indicator, aggregated to country level. Aqueduct under-reports decline in some basins, so read this as a floor.
The systems, and what is known about them
The region’s major aquifer systems, largest first. Where the regional inventory and IGRAC delineate the same system differently, both figures are shown.
| System | Countries | Extent, km² | IGRAC extent, km² | Recharge | What the inventory records |
|---|---|---|---|---|---|
| Nubian Sandstone (NSAS) | Chad, Egypt, Libya, Sudan | 2,000,000 | 2,450,101 | Recharge effectively zero | About 540,000 km³ stored, of which some 15,340 km³ is thought exploitable. |
| North Western Sahara (NWSAS, SASS) | Algeria, Libya, Tunisia | 1,000,000 | 1,041,019 | About 1 bn m³/yr | Abstraction reached 2.5 bn m³/yr, against 0.6 bn in 1970, from roughly 8,800 water points. |
| Saq-Ram (Disi) | Jordan, Saudi Arabia | 308,000 | 151,718 | 2 to 20 mm/yr | Storage 4 to 10 bn m³ in Jordan against about 740 bn m³ in Saudi Arabia; Saudi abstraction above 1,000 MCM/yr. |
| Umm er Radhuma-Dammam, south (Rub al Khali) | Oman, Saudi Arabia, UAE, Yemen | 680,000 | 686,619 | Negligible | Reported abstraction of 45 MCM/yr in Oman and 7.7 MCM/yr in the UAE. |
| Umm er Radhuma-Dammam, centre (Gulf) | Bahrain, Qatar, Saudi Arabia | 281,000 | 291,613 | Negligible | Abstraction of 97 MCM/yr in Bahrain, 91 in Qatar and 608 in Saudi Arabia has left the system open to salinisation. |
| Umm er Radhuma-Dammam, north (Widyan-Salman) | Iraq, Kuwait, Saudi Arabia | 246,000 | 242,966 | Negligible | Water levels have fallen by up to 60 m in both formations. |
| Coastal Aquifer Basin | Egypt, Israel, Palestine | 18,370 | 18,945 | 360 to 420 MCM/yr | Gaza holds about 15% of the sustainable yield, some 55 MCM, and abstracts 150 to 180 MCM a year. |
| Basalt, south (Azraq-Dhuleil) | Jordan, Syria | 8,500 | 8,457 | Renewable | Abstraction of 15 to 20 MCM/yr in the north; the Azraq springs stopped flowing after a well field opened in 1980. |
| Basalt, west (Yarmouk basin) | Jordan, Syria | 7,000 | 6,873 | Renewable | Groundwater provisions sit inside the 1987 Yarmouk river agreement rather than in an aquifer treaty. |
| Nile Delta aquifer | Egypt | 30,000 | – | Renewable, and salinising | About 4,050 bn m³ in place to the hydrogeological base; the main Pleistocene layer thickens from 200 m in the south to 1,000 m in the north. |
Sources: UN-ESCWA and BGR, Inventory of Shared Water Resources in Western Asia (2013), groundwater chapters; Observatoire du Sahara et du Sahel (2008) for the North Western Sahara; the Joint Authority figures for the Nubian Sandstone; Mabrouk et al. (2018) for the Nile Delta volume; IGRAC, Transboundary Aquifers of the Middle East and of Africa (2022) for the delineated extents. The two extent columns disagree because they map different things, and a storage figure for a fossil system is a stock estimate, not water available for use.
The four systems, and the state of each
Nubian Sandstone: the largest, and the one being spent
About 540,000 km³ of water is thought to be stored, of which some 15,340 km³ is considered exploitable, across an area the Joint Authority puts at 2 million km² and IGRAC delineates at 2.45 million.1412 Recharge today is effectively zero.28
Libya’s network is about 4,500 km long and supplies more than 70% of its urban areas. In December 2024 the authority committed to a fifth and final phase costing US$7 billion, against roughly US$25 billion spent since the project’s inception in the early 1980s.29 Nothing about the resource is renewable on a human timeframe.
Saq and Ram, known in Jordan as Disi
Sandstone running under Saudi Arabia and Jordan, supplying Amman through a 325 km conveyance since 2013 at 100 million cubic metres a year from a field of 55 wells, under a 25-year build-operate-transfer concession.1915
The asymmetry is the point. Jordan holds 4 to 10 billion cubic metres of the system against Saudi Arabia’s 740 billion, recharge is 2 to 20 mm a year, and Saudi abstraction near Tabuk rose from about 29 million cubic metres a year in 1983 to between 1,050 and 1,700 million by 2004, against recharge of 3 to 10 million.6 It is also a bridge rather than a supply, which is why Jordan spent the years it bought building a carrier from the sea.
Umm er Radhuma and Dammam: the Gulf’s shallow reserve, turning brackish
Three mapped sections, not one. The southern section under Oman, Saudi Arabia, the UAE and Yemen covers about 680,000 km²; the central section under Bahrain, Qatar and Saudi Arabia about 281,000; the northern section under Iraq, Kuwait and Saudi Arabia about 246,000, where water levels have fallen by up to 60 metres in both formations.789
Abstraction of 97 million cubic metres a year in Bahrain, 91 in Qatar and 608 in Saudi Arabia has left the central section open to salinisation, and seawater intrusion has been reported up to 8 km inland on the Omani coast.51 Where the system still works for cities, it works because water was put back: Abu Dhabi banks desalinated water in the Liwa dunes as a strategic reserve, which is storage rather than abstraction.
North Western Sahara: shared by Algeria, Tunisia and Libya
Over 1 million km², of which 700,000 in Algeria, 80,000 in Tunisia and 250,000 in Libya, recharged by only about 1 billion cubic metres a year.10 IGRAC lists the system with two riparians rather than three.12
Abstraction has quadrupled, from 0.6 billion cubic metres a year in 1970 to 2.5 billion today, which is two and a half times recharge, drawn from roughly 8,800 water points.10 Its pressure comes from irrigation rather than cities, which makes it a problem of metering wells rather than of building plants.
The renewable aquifers, which are the ones actually failing
Coastal and alluvial systems do recharge, and are almost everywhere drawn down faster than rainfall replaces them. That pulls seawater inland and pushes salinity up.
Morocco’s Souss is the clearest measured case: piezometer 859/62 in the upstream Souss fell 1.9 metres a year between 1998 and 2008 and 3.5 metres a year between 2012 and 2020, while the correlation between the rainfall index and the standardised water-level index across the Souss and Massa is 0.07, which points at pumping rather than drought.35 In Iraq’s Sinjar and Ba’aj districts, where groundwater is the only source, more than 75,000 people in Wardiya, Solagh, Tal Banat and Tal Qasab face shortages, rainfall has fallen 40% in five years and 15% of residents have already migrated.30
Case study
One scheme in this sector, examined in full: what was built, what it cost, what worked and what did not.
Interactive dashboard
The hub's headline metric for all twenty countries. Hover, tap or focus a country; the ranked table sits alongside.
Enable JavaScript to load the dashboard.
Where the decline is measured
Four independent measurement methods now cover the region: satellite gravity for whole aquifers, piezometric records for national totals, radar interferometry for the ground surface, and well logs for individual basins. They agree on direction and differ on magnitude, which is worth saying plainly rather than averaging away.
North Africa, from satellite gravity
Between 2003 and 2016 the Nubian system lost around 50 km³ and the North Western Sahara more than 30 km³. The Nubian loss is attributable to abstraction alone; the North Western Sahara loss is part climate and part abstraction, and the nearby Tindouf basin, which tracks rainfall closely, lost under 10 km³.21 Depletion rates have been put at 6.08 ± 1.9 km³ a year for the Nubian and 2.69 ± 0.8 for the Sahara, against non-satellite estimates of 2.2 and 2.17 km³.3
Iran, from well records and radar
Piezometric records across 478 sub-basins give a loss of about 74 km³ between 2002 and 2015, some 5.25 km³ a year, with extreme overdraft across roughly 77% of the land area and a national deficit of 1,737 million cubic metres a year.2223 These are well records, not gravity measurements, so they cannot be added to GRACE totals.
The ground is following the water down. Sentinel-1 interferometry for 2014 to 2020 makes Rafsanjan the fastest-sinking place in the country at 37 cm a year, ahead of Arzuiyeh at 34, Savojbolagh at 29 and Nazarabad at 27, with subsidence hazard across 56,000 km², 3.5% of Iran, where more than 14 million people live.23 Mashhad has the longest record and the clearest pairing of cause and effect: a water table down 65 metres over four decades, and vertical deformation of about 19 cm a year.24
Egypt and Saudi Arabia
For Egypt, GRACE gives depletion of 0.64 ± 0.03 cm a year over Sinai and 0.32 ± 0.03 over the Nile Delta aquifer between 2003 and 2021, with about 7.25 km³ taken from the Nubian in the Western Desert. Losses from the Moghra aquifer rose roughly eightfold across the same period, from 32 to 262 million cubic metres a year.25
Saudi Arabia’s total water storage fell 7.94 ± 0.22 mm a year from 2002 to 2016. The Saq is where the methods genuinely conflict: the same study reports a significant negative storage trend over the aquifer and a positive recharge estimate of 4.65 ± 0.10 km³ a year, so no single clean figure for the Saq can responsibly be quoted.26 Storage under the northern desert is put at 252 to 870 km³, and hydrologists expect only about 50 more years of economic pumping, which is why the wheat programme was phased out from 2008 and ended in 2016.27
Jordan, Morocco and Yemen, from the basin records
Six of Jordan’s twelve basins are pumped at 146 to 235% of safe yield; Azraq, whose four springs dried out in 1992, has fallen about 25 metres in 28 years against a safe yield revised from 20 to 24 million cubic metres a year.42 A separate ministry-based account puts national abstraction at 625 million cubic metres from 3,138 known wells, 130% of a 275 million safe yield, with water levels across six basins falling about a metre a year and the worst single well at nine.41
Morocco’s aquifers run at 100% of recharge in the Moulouya to 248% in Chtouka-Massa, with Tadla, Souss, Haouz and Saïss between 150 and 170%; national withdrawals of about 5 billion cubic metres exceed renewable groundwater by 28%.3334 Levels have dropped 20 to 65 metres across all basins in 30 years.33
In Yemen the water table under Sanaa falls about six metres a year, against two and a half to four and a half elsewhere, and western Yemen is at its lowest level since satellite records began in 2002.3132 Well counts disagree: roughly 100,000 mostly illegal wells are reported for Sanaa and its surroundings alone, and roughly 100,000 for the whole country.3231
One caveat applies to the dashboard above. The World Resources Institute did not update its groundwater-table-decline indicator for the Aqueduct 4.0 release, so that layer is not 4.0-era data and should be read as a floor.72 And any claim that an aquifer becomes uneconomic within a generation rests on a storage estimate, not a depletion rate: for the Sahara, time to 90% depletion ranges from about 10 years to 150,000 years depending on which storage estimate is used.3
Quality: salinity & contamination
Quantity and quality fail together. As a water table drops, the remaining water sits in older, more mineralised rock and gets saltier. Coastal aquifers draw seawater inland to replace what was pumped. Shallow contamination, meaning nitrate from fertiliser, sewage from unsewered districts and industrial discharge, concentrates in a smaller volume.
Gaza is the extreme case, and the best documented. Some 97% of the water extracted from its coastal aquifer is unfit for human consumption against WHO standards, because the only aquifer has been depleted by over-extraction and contaminated by sewage and seawater.4546 A survey of 115 municipal wells found chloride averaging 1,419 mg/L and peaking at 9,491, nitrate averaging 112 mg/L against a WHO guideline of 50, and fluoride up to 2.6 mg/L.47 In the 2017 monitoring round only about one well in nine met the nitrate limit and one in five the chloride limit, and salinity has risen by a third in twenty years while nitrate shows no clear trend.48
On the Gulf coast the same process is measured in kilometres. At Al-Qatif in eastern Saudi Arabia the shallow aquifer runs from 4,220 to 34,090 mg/L of dissolved solids, averaging 10,108, with the intrusion front about 3.5 km inland.49 In the multi-layered aquifers further along the coast, dissolved solids range from 1,955 to 15,560 mg/L.50 On the Libyan coast intrusion was already estimated to be advancing 100 to 250 metres a year in FAO’s 1997 regional survey.54
In the northeastern Nile Delta the salt has reached the soil. Electrical conductivity across surveyed fields runs from 0.53 to 49.7 dS/m and averages 22.2, with 42.8% of the area strongly saline and 21.4% very strongly saline, over shallow groundwater of 837 to 34,900 mg/L sitting half a metre to three metres below the surface.52 Modelling the seawater wedge is harder than it looks: published reconstructions differ on the position of its toe by up to 10 km.53
Nitrate and fluoride are local rather than regional problems, and should not be generalised. On the Angads plain near Oujda in Morocco, nitrate runs from 7 to 171 mg/L and nearly half of samples exceed the WHO limit.56 Globally about a tenth of fluoride measurements exceed 1.5 mg/L, and across 15% of Africa’s land area the probability of exceeding it is above one in two; in Iran’s Bushehr province every monitored station averaged above the guideline, from 1.52 to 3.64 mg/L.5758
Seawater intrusion
The characteristic failure of coastal aquifers from Gaza and the Nile Delta to Libya's coast and Oman's Batinah. It is close to irreversible on human timescales once the salt front moves inland, though not absolutely: injecting tertiary-treated effluent through coastal wells at Salalah pulled the front back from 3.4 km to 2.7 km.
Nitrate and sewage
Unsewered urban expansion and fertiliser leach into shallow aquifers that households then pump for drinking. In Gaza's municipal wells nitrate averages more than twice the WHO guideline, which is why sanitation investment is also groundwater-quality investment.
Salinisation of soil
Irrigating with brackish groundwater in a high-evaporation climate leaves salt behind in the root zone. Yields fall, farmers apply more water to flush it, and abstraction rises. FAO's survey of Iraq found 4% of the irrigated area severely saline, 50% medium and 20% slightly, and the northeastern Nile Delta shows the same loop.
Sources for the case files: Parimalarenganayaki (2020) on the Salalah recharge scheme59; Shomar and Rovira (2023) on Gaza’s municipal wells47; FAO, Irrigation in the Near East region in figures (1997), for the Iraqi salinity shares55; the 2024 Scientific Reports survey for the Nile Delta.52
Recharge & storage
The engineering response is managed aquifer recharge: deliberately putting water underground when it is available and taking it out when it is not. In a region where surface reservoirs lose a punishing share to evaporation, an aquifer is the cheapest large-scale storage available.
Abu Dhabi’s Liwa reserve, and what is actually proven
The scheme holds more than 26 million cubic metres of desalinated water in a dune aquifer, enough to supply the emirate for about 90 days, filled from the Shuweihat plant at 32,000 cubic metres a day over 27 months, with some 315 recovery wells reaching 80 metres and a recovery capacity of 100 million gallons a day, completed in January 2018 at about US$435 million.6160 Earlier figures in circulation are 17 million cubic metres injected in 2012 and a 23 million target, which is worth knowing before quoting any single volume.4362
A recovery efficiency of 88% is widely quoted.59 What is documented is the pilot, where recovery through the wells around the infiltration basin worked without problems and the recovered water most likely met Abu Dhabi’s drinking water standards.60 No published account covers a full-scale recovery cycle, so treat 88% as a claim rather than a demonstrated result.
Recharge dams, which are the region’s largest MAR programme by count
Oman operates 209 dams with a combined capacity of about 458.7 million cubic metres, having impounded more than 3.17 billion cubic metres of floodwater to the end of 2025; the ministry’s own figure in December 2024 was 191 dams and 357.7 million cubic metres, so the series is moving.656664 By type, the stock is 89 surface retention dams, 45 purpose-built recharge dams and 14 flood protection dams, all built since 1985, with recharge efficiency measured at up to 75% in Dhofar.44
Saudi Arabia has 522 dams with 2.3 billion cubic metres of capacity, of which 1.6 billion is utilised, for runoff collection, storage and recharge.67 The UAE’s AQUASTAT register lists 68 dams built between 1982 and 2004, including Al Tawiyeen at 18.5 million cubic metres; at the Wurayah and Tawyeen dams, 20 to 40% of stored water was measured as reaching the aquifer.6859
Reuse to recharge, where it exists
Bahrain has recharged the Khobar aquifer with treated effluent since 1986.39 Oman injects treated wastewater in a managed way in exactly one place, Salalah, where it pulled the saline front back from 3.4 to 2.7 km.4459 Tunisia recharged 20 of 28 targeted aquifers with 38.4 million cubic metres in 2011, 92% of it from hill dams and only 4% from treated wastewater, under a policy that ran experimentally from the 1970s and structurally from 1992.40
Gulf aquifer storage and recovery schemes with published numbers include Kabd in Kuwait, recovering 100,000 cubic metres a day from eight wells at 77% efficiency, Sharjah, and Nizwa in Oman.59 Qatar is often listed alongside them, but the peer-reviewed work there is a siting study rather than infrastructure, identifying zones that could hold up to 182.8 million cubic metres if a scheme were built.63
An aquifer is the only reservoir in this region that does not evaporate.
Market map
Tracked projects involving wells, well-fields, groundwater supply and recharge. Hover a marker for the project and its status; click through to the database.
Only a handful of tracked projects are primarily groundwater schemes. That is the market, not a gap in the database: the region's capital pipeline is dominated by desalination and reuse, and groundwater is mostly abstracted through dispersed private wells that no tender register captures.
Projects & tenders
The tracked projects in this sector and the structured procurements coming next, straight from our databases.
Projects
Rules at the wellhead
Every country in the region licenses wells. Almost none measures what comes out of them, and fewer still charge for it. The gap between the statute book and the wellhead is where groundwater policy actually fails.
- Iran: of about 416,000 authorised agricultural wells, roughly 125,000 carry volumetric smart meters, under a quarter, and more than 400 plains are classed critical or prohibited
- Jordan: By-law 85 of 2002 licenses drilling, rigs and abstraction, but the first 150,000 cubic metres from a single well remain free of charge
- Morocco: Article 115 of Law 36-15 created aquifer contracts, and by the state auditor's 2018 review only one had been signed against a target of ten
- Oman: 180,444 wells and 4,198 aflaj are registered, and meters have effectively never been installed beyond pilots
- Abu Dhabi: Law 6 of 2006 licenses drilling and over 80,000 wells are permitted, but farm metering was dropped after landowner resistance
- Tunisia: authorisation is required only below 50 metres, and the 9,300 deep boreholes counted in 2010 had no meters, so declared volumes cannot be checked
Iran shows the measurement gap at its largest. Of about 416,000 authorised agricultural wells, roughly 125,000 carry volumetric smart meters, under a quarter, and the obligation to fit them runs back through the Fair Water Distribution Law and at least fifteen later annual laws without a completion deadline.69
Jordan has gone furthest on enforcement. More than 1,293 illegal wells had been backfilled or capped by 2016, 644 of them by June 2015, alongside 1,228 notices, halted rigs and stopped excavators, with meter-installation compliance reaching 95%; up to 159 drilling rigs had been confiscated by April 2015.4138 The pricing, though, still exempts the first block, which is the clearest example in the region of measuring without charging.41
Morocco shows the other failure mode, which is an instrument that exists on paper. The aquifer contracts rest on Article 115 of the 2016 water law, piloted on Souss and Mnasra from 2007 and codified after an interministerial circular in November 2013; by the Cour des comptes’ review only the Souss contract had been signed against ten targeted by the end of 2018, the implementing decree was unpublished, Chtouka was the only gazetted safeguard zone, and more than 102,264 abstractors were operating outside the authorisation regime altogether.3637 Metering, a key Souss measure, was postponed.38
The older statutes are sound enough. Oman declared its groundwater public wealth by royal decree in 1988 and required registration and permits from 1990, with power to set permissible discharge and require flow meters; the well inventory that followed registered more than 167,000 wells, and the law on meters was never effectively applied.4465 Egypt has required a ministry permit to dig any well since Article 46 of Law 12 of 1984, for no more than ten years at a time.39 Saudi Arabia regulated drilling permits by executive order in 1989 for farms above 2.5 hectares.39 In Algeria’s Wilaya of Blida, on the Mitidja plain, 2,000 illegal wells sit alongside 1,200 legal ones.39 Abu Dhabi prosecuted 34 illegal-drilling cases in 2012 and 87 in 2013, and issues about 1,750 new well permits a year.43
Shared aquifers & governance
Almost every major aquifer here crosses a border, and almost none is governed by a binding sharing agreement. IGRAC’s current global map, published in 2021, identifies 468 transboundary aquifers and aquifer systems, up from 366 in 2015, of which 106 are in Africa.1112 For the Arab region specifically, 42 transboundary aquifer systems cover almost 58%% of the land area, and every Arab state except the Comoros draws on at least one.4 Across Africa, cooperation has been formalised for seven.13
The regional inventory is blunt about the record. Its 26 chapters, nine on surface water and 17 on groundwater, conclude that there are no specific agreements on shared groundwater resources in Western Asia, though a few bilateral agreements include groundwater provisions.5 That was written in 2013, which is what makes the next paragraph the exception.
Disi, 2015: the one operational aquifer agreement
Signed in Riyadh on 30 April 2015 and in force from the date of signature. It creates a protected area of about 400 km² on each side of the border, requires the elimination within five years of all activities there that depend on extracting groundwater, adds a management area of roughly 1,000 km² each side limited to municipal abstraction, and is reviewed every 25 years.1815 The agreement works with survey markers rather than a fixed width, so the “10 km each side” figure in press coverage should not be repeated.
Nubian Sandstone: an authority, and data sharing
Egypt and Libya created a joint authority in 1989 and adopted its constitutive agreement in 1992, seated in Tripoli; Sudan joined in 1996 and Chad in 1999.1416 Two further instruments on monitoring and the exchange of groundwater information followed in October 2000, and all four water ministers signed a Regional Strategic Action Programme on 18 September 2013.1614 None of it allocates water.
North Western Sahara: a mechanism without a treaty
There is no treaty. A procès-verbal was endorsed separately by Algeria on 6 January 2003, Tunisia on 15 February and Libya on 23 February.17 Options agreed at FAO headquarters in December 2002 led through Algiers and Tunis in 2005 to the creation of a consultation mechanism and its secretariat at the Sahara and Sahel Observatory in November 2007.10
The Mountain Aquifer: interim arrangements, thirty years on
Governed by Article 40 of Annex III to the Oslo II agreement of 28 September 1995, under which Israel recognised Palestinian water rights in the West Bank to be negotiated in permanent status talks, a Joint Water Committee was created for the interim period, future Palestinian needs were estimated at 70 to 80 million cubic metres a year, and 28.6 million a year was to be made available.20 The interim period has outlasted the arrangement.
Our Region Atlas maps the transboundary aquifer systems (IGRAC) alongside river basins and infrastructure.
Business opportunities
Where the commercial and donor activity concentrates:
Monitoring & metering
Regulators cannot cap what they cannot measure. Telemetry on wells, satellite-gravity and InSAR subsidence monitoring, and national groundwater information systems are funded work across the Gulf and North Africa.
Managed aquifer recharge
Design, construction and operation of recharge dams, infiltration basins and injection well-fields, increasingly paired with reuse schemes.
Brackish desalination
Inland RO on brackish groundwater is far cheaper than seawater desalination and is the standard fix for salinised supply in Egypt, Saudi Arabia and the Gulf interior.
Well-field rehabilitation
Deepening, relining and re-equipping ageing well-fields, plus the pump and drilling services that go with them.
Hydrogeological modelling
Aquifer characterisation and numerical modelling underpins every abstraction licence, DFI appraisal and transboundary negotiation in the region.
Solar pumping controls
Solar irrigation cut costs but removed the fuel-price brake on pumping; metering and control systems that pair with solar are an emerging niche.
Who to know
The bodies that commission, regulate or deliver in this sector, and the names that recur across its tenders.
- Ministry of Environment, Water & Agriculture (MEWA)Ministry · Saudi Arabia
- Ministry of Water & Irrigation (MWI)Ministry · Jordan
- Environment Agency – Abu Dhabi (EAD)Environment · United Arab Emirates
- Hydraulic Basin Agencies (ABH, ×10)Basin & resources authority · Morocco
- UN-ESCWARegional body · Regional
Mandates, procurement routes and the rest of the region’s institutions are in the decision-maker directory.
Outlook
The direction of travel is not in doubt. What is genuinely uncertain is the timetable, and the uncertainty sits in storage rather than in depletion: for the Sahara systems, the time to 90% depletion ranges from about a decade to 150,000 years depending on which storage estimate is used.3 Saudi hydrologists expect about 50 more years of economic pumping in the north.27 Some coastal systems, meanwhile, are already effectively lost to salt.
The encouraging signal is that the biggest users have started acting. Saudi Arabia ended its wheat programme to save groundwater, Abu Dhabi banks desalinated water underground, and Jordan protects the Disi zone by treaty. The discouraging signal is that solar pumping has removed the fuel-cost brake on abstraction, exactly where governance is weakest, and has the potential to exceed what diesel ever pumped.32
Strategic storage has also acquired a security argument. Desalination supplies about 90% of Kuwait’s drinking water, 86% of Oman’s, 70% of Saudi Arabia’s and 42% of the UAE’s, and in early March 2026 reported strikes damaged desalination plants in both Bahrain and Iran.7071 The damage was limited and supply held, but the exposure was the point, and an aquifer is the one reserve that cannot be hit from the air. Groundwater management here is now less a hydrological problem than an institutional one.
Further reading
Standing references for this sector. Every one is a real work and every link was checked.
- IGRAC, Global Groundwater Information System. The transboundary aquifer inventory, and the polygons behind the aquifer maps on this site. un-igrac.org
- Transboundary Waters Atlas, the shared-basin and shared-aquifer reference this site links to for every cross-border system. transboundarywatersatlas.org
- FAO AQUASTAT, the standing database of national water resources, withdrawals and irrigated area. The denominator behind most figures on this site. fao.org
Sources
77 references
- Voss, K.A. et al. (2013), “Groundwater depletion in the Middle East from GRACE with implications for transboundary water management in the Tigris-Euphrates-Western Iran region”, Water Resources Research 49, full text via PubMed Central.
- Richey, A.S. et al. (2015), “Quantifying renewable groundwater stress with GRACE”, Water Resources Research 51, author copy via eScholarship.
- Richey, A.S. et al. (2015), “Uncertainty in global groundwater storage estimates in a Total Groundwater Stress framework”, Water Resources Research 51, author copy via eScholarship.
- UNESCO and UN-Water (2022), World Water Development Report 2022: Groundwater, facts and figures.
- UN-ESCWA and BGR (2013), Inventory of Shared Water Resources in Western Asia, information brochure.
- UN-ESCWA and BGR (2013), Inventory of Shared Water Resources in Western Asia, chapter 10: Saq-Ram aquifer system.
- UN-ESCWA and BGR (2013), Inventory of Shared Water Resources in Western Asia, chapter 14: Umm er Radhuma-Dammam aquifer system, south.
- UN-ESCWA and BGR (2013), Inventory of Shared Water Resources in Western Asia, chapter 15: Umm er Radhuma-Dammam aquifer system, centre.
- UN-ESCWA and BGR (2013), Inventory of Shared Water Resources in Western Asia, chapter 16: Umm er Radhuma-Dammam aquifer system, north.
- Observatoire du Sahara et du Sahel (2008), The North-Western Sahara Aquifer System (Algeria, Tunisia, Libya), Synthesis No. 1.
- IGRAC, “IGRAC launches new Transboundary Aquifers of the World Map 2021”, 3 December 2021.
- IGRAC (2022), Transboundary Aquifers of Africa map, and Transboundary Aquifers of the Middle East map.
- Altchenko, Y. and Villholth, K.G. (2018), “Transboundary aquifers of Africa: review of the current state of knowledge”, Journal of Hydrology: Regional Studies, doi:10.1016/j.ejrh.2018.03.004.
- International Water Law Project, “Adoption of a regional strategic action plan on the Nubian Sandstone Aquifer”, 20 October 2013.
- International Water Law Project, “The newest transboundary aquifer agreement: Jordan and Saudi Arabia cooperate over the Al-Sag/Al-Disi aquifer”, 31 August 2015.
- IW:LEARN, legal frameworks: Nubian Sandstone Aquifer System.
- IW:LEARN, legal frameworks: North Western Sahara Aquifer System.
- Agreement between Jordan and Saudi Arabia for the management and utilisation of ground waters in the Al-Sag/Al-Disi layer, signed 30 April 2015, unofficial English translation.
- U.S. International Development Finance Corporation, Disi Water: non-confidential project information.
- Oslo II Interim Agreement, 28 September 1995, Annex III Article 40, excerpts reproduced in National Academies Press (1999), NCBI Bookshelf NBK230239.
- Mohamed, A. et al. (2020), “Groundwater storage changes in the major North African transboundary aquifer systems during the GRACE era (2003–2016)”, Water 12(10):2669, doi:10.3390/w12102669.
- Noori, R. et al. (2021), “Anthropogenic drought dominates groundwater depletion in Iran”, Scientific Reports, full text via PubMed Central.
- “Uncovering the impacts of depleting aquifers: a remote sensing analysis of land subsidence in Iran” (2024), Science Advances, full text via PubMed Central.
- Dehghani, M. et al. (2020), “Extreme subsidence in a populated city (Mashhad) detected by PSInSAR”, Scientific Reports, full text via PubMed Central.
- “Satellite-based estimates of groundwater storage depletion over Egypt” (2023), Environmental Monitoring and Assessment, full text via PubMed Central.
- Alghamdi, A. et al. (2022), “Application of time-variable gravity to groundwater storage fluctuations in Saudi Arabia”, Frontiers in Earth Science, doi:10.3389/feart.2022.873352.
- USGS EROS, Earthshots: Fossil Water, and “Saudi wheat experiment relied on fossil water”, 21 November 2016.
- Eos (AGU), “Ancient water underlies arid Egypt”, 18 June 2019.
- The Middle East Observer, “Libya’s Great Man-Made River project nears completion”, 10 December 2024.
- United Nations in Iraq, “Rain brief: recent rainfall and water situation in Iraq”, 5 June 2026.
- UNDP (2022), A holistic approach to addressing water resources challenges in Yemen.
- Conflict and Environment Observatory, “Groundwater depletion clouds Yemen’s solar revolution”, April 2021.
- Bahir, M. et al. (2020), “Moroccan groundwater resources and evolution with global climate changes”, Geosciences 10(2):81, copy via IRD.
- World Bank (2023), Morocco CCDR background note: water scarcity and droughts.
- Gouahi, S. et al. (2025), “Assessment of groundwater drought risk in arid regions”, Frontiers in Water, doi:10.3389/frwa.2025.1628691.
- Cour des comptes (Morocco), Gestion du domaine public hydraulique, annual report for 2018.
- Finances News Hebdo, “Les contrats de nappe, entre acquis mitigés et contraintes”, 6 November 2022.
- Molle, F., Closas, A. and Al-Zubari, W. (2017), “Governing groundwater in the MENA region”, in Advances in Groundwater Governance, CRC Press.
- IWMI and USAID, Groundwater Governance in the Arab World, Report No. 1: taking stock and addressing the challenges.
- IWMI and USAID, Groundwater Governance in the Arab World, Report No. 7: Tunisia, December 2016.
- IWMI and USAID, Groundwater Governance in the Arab World, Report No. 11: Jordan.
- IWMI and USAID, Groundwater Governance in the Arab World, Report No. 12: the Azraq basin, Jordan.
- IWMI and USAID, Groundwater Governance in the Arab World, Report No. 13: Abu Dhabi.
- IWMI and USAID, Groundwater Governance in the Arab World, Report No. 14: Oman.
- UN OCHA, occupied Palestinian territory, “Study warns water sanitation crisis in Gaza may cause disease outbreak”, 16 November 2018.
- UN-ESCWA (2023), War on Gaza: weaponizing access to water, energy, food and land.
- Shomar, B. and Rovira, J. (2023), “Human health risks associated with the consumption of groundwater in the Gaza Strip”, Heliyon 9(11), full text via PubMed Central.
- “Drinking water access and quality in the Gaza Strip prior to 7 October 2023 and implications for reconstruction” (2025), Environmental Health, full text via PubMed Central.
- “Integrated hydrogeological, hydrochemical and isotopic assessment of seawater intrusion in Al-Qatif” (2022), Molecules 27(20):6841, full text via PubMed Central.
- “Effects of seawater intrusion on the groundwater quality of multi-layered aquifers in eastern Saudi Arabia” (2023), Molecules, full text via PubMed Central.
- “Water resources availability, sustainability and challenges in the GCC countries” (2023), Heliyon 9(10), full text via PubMed Central.
- “Monitoring soil salinization and waterlogging in the northeastern Nile Delta linked to shallow saline groundwater and irrigation water quality” (2024), Scientific Reports, doi:10.1038/s41598-024-77954-x.
- “A three-dimensional palaeohydrogeological reconstruction of the groundwater salinity distribution in the Nile Delta aquifer” (2019), Hydrology and Earth System Sciences 23, doi:10.5194/hess-23-5175-2019.
- FAO (1997), Irrigation in the Near East region in figures: Libya.
- FAO (1997), Irrigation in the Near East region in figures: Iraq.
- “Assessment of groundwater pollution using the PIG index in the Angads plain, Morocco” (2025), Scientific Reports, full text via PubMed Central.
- Podgorski, J. and Berg, M. (2022), “Global analysis and prediction of fluoride in groundwater”, Nature Communications, full text via PubMed Central.
- “Data on fluoride contents in groundwater of Bushehr province, Iran” (2018), Data in Brief, full text via PubMed Central.
- Parimalarenganayaki, S. (2020), “Managed aquifer recharge in the Gulf countries: a review and selection criteria”, Arabian Journal for Science and Engineering 46, full text via PubMed Central.
- GRIPP and IWMI, “A strategic water reserve in Abu Dhabi”, August 2018.
- WaterWorld, “World’s largest man-made desalinated water reserve completed in Abu Dhabi”, 22 January 2018.
- “Modeling aquifer storage and recovery in the eastern district of the United Arab Emirates using MODFLOW” (2022), Scientific Reports, full text via PubMed Central.
- “GIS-based framework for artificial aquifer recharge to secure sustainable strategic water reserves in Qatar” (2021), full text via PubMed Central.
- Oman Observer, “Oman has 191 water dams”, 7 December 2024.
- Oman Observer, “Oman reaffirms commitment to water resource sustainability”, 21 March 2026.
- Oman Observer, “Beyond water: the true value of Oman’s dams”, 18 July 2026.
- Alwazir, A. (2022), Saudi Arabia’s water sector, US-Saudi Business Council.
- FAO AQUASTAT, Dams of the United Arab Emirates (register, 2008 profile).
- Tehran Times, “25% of agricultural water wells equipped with smart meters”, 11 August 2026.
- Al Jazeera, “How targeting of desalination plants could disrupt water supply in the Gulf”, 8 March 2026.
- Geneva Water Hub, “Desalination plants under fire in the Gulf conflict”, 23 March 2026.
- World Resources Institute, Aqueduct 4.0 data FAQ (2023).
- FAO, AQUASTAT — Global Information System on Water and Agriculture: country water resources, withdrawals by sector and dam register. fao.org/aquastat. Latest country values as compiled at build.
- World Bank, World Development Indicators and country water-sector reporting. data.worldbank.org.
- Kaufmann & Kraay, Worldwide Governance Indicators (World Bank), 2024 update — political-stability and regulatory-quality scores, 0–100, shown in the market snapshot. worldbank.org/wgi.
- World Resources Institute, Aqueduct 4.0 Water Risk Atlas (2023) — the sub-basin risk, stress and groundwater-decline layers on the interactive maps. wri.org/aqueduct.
- MENA Water Review major projects register and PPP pipeline — compiled from procurer publications, development-bank project pages and trade reporting; each record names its source.
Numbered references are linked from the superscript markers in the text. Figures without a marker come from the sources above as compiled in the site methodology.
Latest intelligence
Partnership
Partner with the Groundwater & Aquifers hub
One organisation can sponsor this hub: your name and logo on the page, a profile in the organization directory, and first sight of the research we publish here. We take one partner per hub and we say who they are.