
Dams, Storage & Conveyance
Dams, reservoirs, canals and the long-distance conveyors that move water across deserts: the region's heaviest and longest-lived water assets.
Why it matters
Between the source and the tap sits the least glamorous, most capital-hungry part of the water sector. It is dams, conveyors, pumping stations and thousands of kilometres of pipe. In the MENA region this plumbing does extraordinary things. It lifts desalinated seawater about 700 metres into the hills for Amman. It moves fossil water 325 km across Jordan’s desert, and it carries a river’s worth of water beneath Libya’s Sahara.7126 It is also where the region loses the most: Jordan’s kingdom-wide non-revenue water was 50.0% in 2022, and 68.8% in Mafraq governorate.2
The stakes of maintenance were written in Derna in September 2023. Two 1970s dams failed above the city during Storm Daniel. The engineering post-mortem found the number of fully destroyed buildings about twenty times higher than in a dam-free scenario, and attributed the failure to inadequate design rather than to mechanical malfunction: a flood of some 39 million cubic metres against upstream storage of about 22 million.1 The rainfall’s return period, the same study found, was only a few decades. The region’s heaviest assets are also its oldest.
State of the region
The stock is impressive and stressed at the same time. The Nile, Euphrates and Jordan systems are fully plumbed with dams, and the Gulf runs the world’s densest desalination-to-city transmission grids. Mega-conveyors knit surplus to deficit: Disi, Libya’s Great Man-Made River, Jordan’s coming Aqaba to Amman carrier, Morocco’s north-south water highway. But networks age faster than they are renewed, and dam safety, Mosul above all, remains a live engineering concern.
Network losses are the subject of the Utilities & Urban Water hub, which carries the country comparison; this hub covers the storage and conveyance assets themselves.
The asset classes, and how each is failing or changing
Dams: the oldest assets, and the least maintained
The register this site compiles from FAO’s regional inventories holds 1,309 large dams with a published design capacity, totalling about 561 km³. Read it as a register, not a census: it lists 73 Saudi dams against the 574 the kingdom’s own procurement agency counts, and 582 Turkish dams for all purposes against 75 drinking-water dams built in the last 23 years alone.521
Storage figures flatter, and 2026 showed why. Iraqi live storage rose from about 3.5 to 20 billion cubic metres over one wet winter, which the United Nations calculates as about a quarter of the 56 billion lost since 2020, and it warned that higher evaporation means storage figures overstate the net hydrological benefit.8 Even then, Iraq’s reservoir capacity exceeds 100 billion cubic metres, so a good winter left the system under a fifth full.8 At Mosul, the grouting contract that keeps the dam standing was worth €273 million, with holes drilled to 200 metres.26
Long-distance conveyance: the region’s signature engineering
Conveyors knit surplus to deficit. Disi moves 100 million cubic metres a year 325 km to Amman from 55 wells, built between 2009 and 2013 on a 25-year build-operate-transfer contract, and meets about 30% of the capital’s needs.12 Libya’s Great Man-Made River runs about 4,500 km and supplies more than 70% of its urban areas; a fifth phase was committed in December 2024 at US$7 billion over six years, against roughly US$25 billion spent since the 1980s. Its fifth river alone is about 1,500 km of new pipe and more than 2.5 million cubic metres a day from 320 wells south of Kufra.6
Jordan’s Aqaba to Amman carrier is the next of them, and its profile explains the cost: 438 km of buried steel up to 2.3 metres in diameter, lifting water about 700 metres to a high-point reservoir at roughly 1,085 metres before running 250 km downhill to Amman, carrying 300 million cubic metres a year of which 250 million goes to the capital. Steel was chosen over ductile iron, which would have needed two parallel lines, and over glass-reinforced plastic and prestressed concrete cylinder pipe. Construction runs about 48 months from the second quarter of 2026, for commissioning in 2030.7 Morocco’s water highway is the cheap version of the same idea: a 67 km transfer from the Sebou to the Bouregreg, costing US$728 million, which had moved more than 700 million cubic metres by March 2025 for about 12 million people.13
Transmission as a procured asset class
The newest development is that pipelines are tendered the way plants were. Saudi Arabia named a preferred bidder in December 2025 for the 859 km Riyadh to Qassim line at SAR 2.627 a cubic metre, against a reserve bid of SAR 3.262, on a 35-year build-own-operate-transfer term with commercial operation in the second quarter of 2030. The same procurement carries six strategic tanks in Riyadh holding 1.02 million cubic metres.9
It is not three pipelines but seven: 2,846 km and 4.42 million cubic metres a day, of which one is operational, two are building and four are in tender, the tendered four alone accounting for 2,066 km and 2.64 million cubic metres a day.5 The tariffs set now will anchor every one that follows. Iraq is doing the same at smaller scale: 240 km of pipeline, a main pumping station and nine receiving stations for the Basra scheme, awarded at US$1.32 billion.1011
Distribution: where the water is actually lost
Networks age faster than they are renewed, and the spread is wide: 50.0% kingdom-wide in Jordan in 2022, 33% in Oman in 2024 to 2025 against 47% in 2021, 33% in Saudi Arabia in 2025 on a published path to 15% by 2031, 25% in Tunisia, and 6.6% in Dubai by 2019 against 42% in 1988.21751519 Bahrain has moved the other way, replacing a 15% target with 23% by 2032 under a new master plan.20
Read those percentages carefully, because they are not measured the same way. Jordan counts water put into supply less water billed; Palestine’s authority adds non-payment, which its own strategy concedes is strictly speaking not non-revenue water, and puts the total at 38% of supply or 285 litres per property a day.324 Intermittent supply changes the arithmetic again: Jordan’s utilities switched to intermittent regimes nationwide, and supply duration and operating pressure head the list of factors its central unit must normalise for before any comparison means anything.2
Storage that is not a dam
Qatar raised its reserve from 1.3 days in 2010 to 5.2 days in 2024, on 15 concrete reservoirs each about 300 by 150 by 12 metres, 2,417 million gallons in total, commissioned at the end of 2018.18 Saudi Arabia held 25.1 million cubic metres in 2025, which is 1.2 days of urban demand, and plans 70.52 million by 2031, or 5.6 days, with Juranah at 2.50 million cubic metres under construction and Dammam at 3.13 million and Al Ahsa at 1.39 million in tender.5
The 2026 strikes on Gulf desalination plants made this the live question, and the honest answer is that the programmes pre-date the strikes: Saudi Arabia’s published plan adds 45.42 million cubic metres by 2031, and none of it has visibly been accelerated. Its own strategy requires emergency storage to rise from 2.7 days in 2024 to 3.7 by 2030, while a seven-day standard in 2031 would need 126.11 million cubic metres, nearly twice what is planned.5
Case study
One scheme in this sector, examined in full: what was built, what it cost, what worked and what did not.
The region's largest dams
Storage is the oldest water technology in this region and still the most consequential. A dam decides how much of a flood year survives into a dry one. On shared rivers it also decides who controls the timing of the flow, which is why the largest reservoirs here are engineering assets and standing diplomatic facts at the same time.
Three caveats matter commercially. First, published capacity is design capacity: decades of sedimentation have taken a material bite out of usable storage across the region, and desilting and rehabilitation are a real and growing market. Second, evaporation from open reservoirs in this climate is punishing, which is why aquifer storage increasingly competes with surface storage for new investment. Third, this is a register rather than a census: it counts large dams with a published design capacity, so national totals are higher, and two Iraqi entries, Tharthar and Raza Dyke, are regulated depressions rather than river dams.
Storage on the register
Large dams with a published capacity, ranked by total design storage.
| Country | Dams on the register | Design storage, million m³ | Largest dam | Its capacity, million m³ |
|---|---|---|---|---|
| Egypt | 5 | 168,197 | High Aswan dam | 162,000 |
| Turkey | 582 | 157,826 | Atatürk | 48,700 |
| Iraq | 9 | 151,800 | Thartar | 85,000 |
| Iran | 83 | 31,610 | Karkheh | 5,575 |
| Morocco | 150 | 19,890 | Al Wahda | 3,730 |
| Syria | 78 | 16,568 | Al Tabqa | 12,000 |
| Algeria | 84 | 9,582 | Beni Haroun | 1,000 |
| Tunisia | 75 | 3,215 | Sidi Salem | 555 |
| Saudi Arabia | 73 | 1,004 | King Fahd | 325 |
| Yemen | 46 | 439 | Ma'areb | 400 |
| Libya | 18 | 390 | Qattara | 135 |
| Jordan | 10 | 275 | King Talal | 75 |
| Lebanon | 2 | 228 | Qaraoun | 220 |
| Oman | 29 | 88 | Khasab | 16 |
| United Arab Emirates | 65 | 61 | Al Tawiyeen | 18 |
Source: FAO AQUASTAT regional dam inventories (CC BY 4.0). The register lists large dams with a published design capacity, so it undercounts small and recent structures, and design capacity is not live storage: siltation and operating rules both cut what a reservoir actually holds.
| Dam | Country | River | Completed | Capacity (MCM) | Purpose |
|---|---|---|---|---|---|
| High Aswan dam | Egypt | Nile | 1970 | 162,000 | Irrigation, Flood control |
| Thartar | Iraq | — | — | 85,000 | Irrigation |
| Atatürk | Turkey | Fırat | 1992 | 48,700 | Irrigation, Hydropower |
| Keban | Turkey | Fırat | 1975 | 31,000 | Hydropower |
| Raza Dyke | Iraq | — | 1970 | 26,000 | — |
| Mosul | Iraq | Tigris | 1983 | 12,500 | Irrigation |
| Al Tabqa | Syria | Euphrates | 1973 | 12,000 | Irrigation, Hydropower |
| Karakaya | Turkey | Firat | 1987 | 9,580 | Hydropower |
| Haditha | Iraq | — | 1984 | 8,200 | Irrigation, Hydropower |
| Dokan | Iraq | Lesser Zab | 1961 | 6,800 | Irrigation |
| Hirfanlı | Turkey | Kızılırmak | 1959 | 5,980 | Flood control, Hydropower |
| Altınkaya | Turkey | Kızılırmak | 1988 | 5,763 | Hydropower |
| Karkheh | Iran | Karkheh | 2001 | 5,575 | Irrigation, Flood control |
| Old Aswan dam | Egypt | Nile | 1933 | 5,000 | Irrigation, Hydropower |
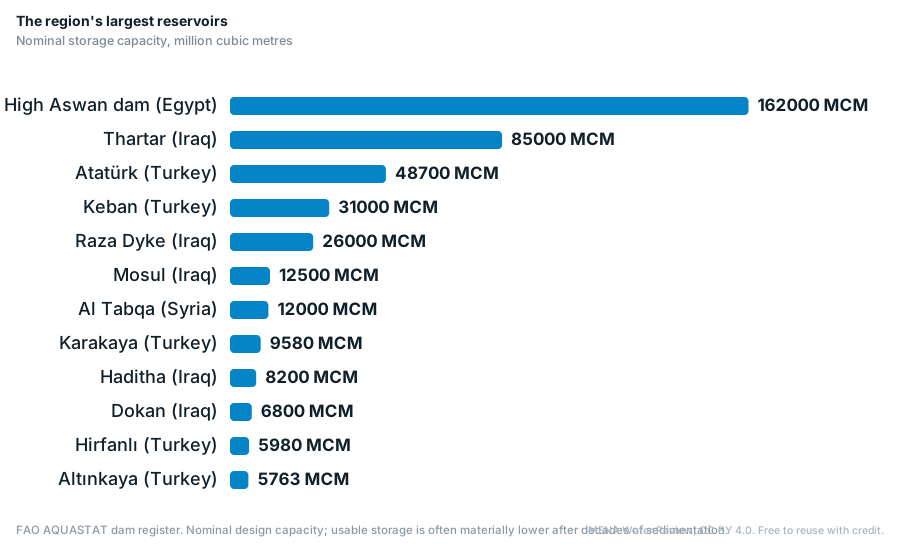
The largest reservoirs in the region by storage capacity, from the FAO AQUASTAT dam register. Storage is nominal design capacity; actual usable storage is often materially lower after decades of sedimentation.
Every dam we hold with coordinates appears on the country maps and in the Region Atlas.
The region's largest reservoirs
Nominal storage capacity, million cubic metres
FAO AQUASTAT dam register. Nominal design capacity; usable storage is often materially lower after decades of sedimentation.
Market map
Major tracked infrastructure works: dams, conveyors and bulk systems. Hover a marker for the project and its status.
Projects & tenders
The tracked projects in this sector and the structured procurements coming next, straight from our databases.
Projects
In procurement
How the deals are structured
Delivery models split by asset class. Dams and trunk conveyance are mostly EPC with sovereign or development-bank finance. Bulk-supply schemes increasingly use BOT concessions; Disi was delivered by a developer under one that runs 25 years. Distribution is the realm of performance-based contracts, in which a contractor is paid against measured leakage reduction. Three references:
Disi Conveyance, Jordan
A 325 km build-operate-transfer scheme pumping about 100 million cubic metres a year of fossil groundwater from the Saudi border to Amman since 2013, from 55 wells and some 120 km of collection pipes, and meeting roughly 30% of the capital's needs. Proof that a bankable water concession can work outside the Gulf.
Great Man-Made River, Libya
The largest water scheme ever built, about 4,500 km of pipe carrying Saharan fossil water to more than 70% of Libya's urban areas. Its board committed to a US$7 billion fifth phase in December 2024, against roughly US$25 billion spent since the 1980s. The pipe factory at Brega that made its prestressed concrete sections was destroyed in 2011, so rehabilitation now depends on imports.
Aqaba to Amman carrier
A project agreement signed in January 2025 with the Meridiam and SUEZ consortium, connecting Red Sea desalination to the capital through 438 km of steel and a 700 metre lift, with construction from the second quarter of 2026 and commissioning in 2030. Its 485 hectare solar plant is sized to run the desalination plant and the Aqaba pump stations in daylight.
Sources: MEED on the Disi concession12; AGBI on the Great Man-Made River6; the project’s own environmental and social documentation for the Aqaba to Amman carrier.7
Technologies & approaches
- District metered areas and pressure management: the fastest, cheapest non-revenue water wins, and Jordan's own policy puts apparent-loss reduction ahead of capital-intensive rehabilitation
- Trenchless rehabilitation (CIPP lining, pipe bursting) for old urban mains
- Large-diameter steel transmission, chosen at Aqaba to Amman over ductile iron, GRP and prestressed concrete cylinder pipe
- Dam safety instrumentation and grouting, as in Mosul's continuous programme
- Pump-station efficiency retrofits and variable-frequency drives, used on all three Aqaba to Amman booster stations
- SCADA and hydraulic digital twins for whole-network operation
Two measured results are worth more than any product list. In Grand Sfax, a Tunisian utility programme with Japanese cooperation cut losses in the medina pilot zone from 50% to 26%, inspecting 180 km of network in 2025 against an annual target of 100 km.14 In Algiers and Tipaza, about 24,000 leak repairs saved 8 million cubic metres in 2024 on a system mobilising 387 million cubic metres.16 Both are unglamorous, and both beat any new source on cost.
Standards & regulation
Reference frameworks used across the region’s projects:
| Regulation | Status | Year | Note |
|---|---|---|---|
| IWA water balance / AWWA M36 | In force | – | The standard method for auditing non-revenue water; Jordan applies a simplified IWA balance adapted locally. |
| ISO 24512 (drinking-water service management) | In force | 2007 | Service and asset-management benchmark for utilities. |
| ICOLD dam-safety guidelines | In force | – | Basis for national dam-safety programmes. |
| Türkiye – National Water Plan | In force | 2026–35 | Network losses to 25% by 2030; regulation already requires 30% within five years. |
| Saudi Arabia – loss trajectory | Published | 2025–31 | Leakage and network losses from 33% in 2025 to 15% in 2031, with per-capita demand from 345 to 300 l/d. |
| National plumbing and network codes | In force | – | Materials and pressure classes vary by country. |
Reference list; specifications are set per project, and loss definitions differ enough between countries that headline percentages are not directly comparable.
Sources: the EU-funded non-revenue water policy work for Jordan2; the Turkish plan as announced22; Sharakat’s seven-year statement.5
Economics
Non-revenue water is the sector’s best business case. Recovering a cubic metre of leakage in Amman costs a fraction of producing a new one at Aqaba and lifting it 700 metres. Jordan puts the cost of persistent losses at more than JOD 350 million a year to its water authority and the three public companies, and has committed over JOD 774 million to loss reduction for 2021 to 2030, against JOD 63 million in the whole of 2000 to 2010.2 Palestine values a three-point cut, from 38% to 35%, at US$40 million of revenue over ten years.24 The measured baseline is the one to work from: kingdom-wide non-revenue water stood at 50.0% in 2022 on the central unit’s official figures, against 68.8% in Mafraq and 32.9% in Karak.2
Energy is the other half of the arithmetic, and in Jordan it is the larger half: electricity is over half of utility operating costs, and the water sector is the country’s single largest energy consumer.3 Conveyance there runs at about 7.11 kWh a cubic metre against 0.5 for treatment, and conveyance energy is projected to roughly double to 3,172 GWh by 2050 under every scenario modelled.25 That is why solar is designed into new carriers from day one rather than retrofitted.7
Mega-conveyance still lives on sovereign balance sheets and development-bank loans, and the binding constraint is often disbursement rather than finance. Baghdad’s World Bank water project, a US$210 million loan approved in January 2018, had disbursed US$39.9 million, 19%, by April 2023; 134 km of a 380 km network-replacement target was delivered, and the target was then cut to 137 km because further projects went unapproved.4 Capital is not the scarce input everywhere it is assumed to be.
Who to know
The bodies that commission, regulate or deliver in this sector, and the names that recur across its tenders.
- Sharakat (Saudi Water Partnership Company)PPP procurer · Saudi Arabia
- Ministry of Water ResourcesMinistry · Syria
- Ministry of Water & Irrigation (MWI)Ministry · Jordan
- Public Works Authority (Ashghal)Infrastructure delivery · Qatar
- ACWA PowerDeveloper / operator · Saudi Arabia
- AccionaEPC & technology · Regional
Mandates, procurement routes and the rest of the region’s institutions are in the decision-maker directory.
Business opportunities
Where the near-term money is:
Performance-based NRW contracts
Jordan has secured over JOD 774 million for loss reduction to 2030 and pays for measured results.
AAWDC construction packages
marine intake, 438 km of steel pipe, three booster stations, a 485 ha solar plant and grid connection, from 2026.
GMMR rehabilitation
Libya's reconstruction agenda begins with its water lifeline, and the pipe factory that supplied it no longer exists.
Dam safety & storage recovery
instrumentation, grouting and sediment management from Iraq to Morocco; Mosul's own contract ran to €273 million.
Transmission for desalination
seven Saudi transmission projects total 2,846 km, four of them still in tender.
Strategic reservoirs
Saudi Arabia alone plans 45.42 million m³ of new storage by 2031, procured like plants.
Outlook
The region’s next decade of infrastructure is already visible: carriers from the coasts inland, networks rebuilt around measured performance, and storage operated for droughts that arrive more often. Iraq’s own risk assessment now puts droughts of the 2023 type at 25 times more likely, with temperatures 1.6 to 2.4 °C higher by 2041 to 2060.8
The quieter change is institutional, as utilities that once built assets learn to sweat them. Three numbers make the case better than any strategy: Oman now runs 416 district metered areas across 2,400 operational assets; Saudi Arabia intends to cut urban demand per person from 345 to 300 litres a day mainly by fixing leaks; and Egypt, at 98% water coverage against 65% sanitation coverage, shows where the next decade of pipe actually has to go.17523
Further reading
Standing references for this sector. Every one is a real work and every link was checked.
- Sharakat, 7 Year Statement 2025–2031 (March 2026), for transmission and storage as procured asset classes rather than public works. sharakat.com.sa
- FAO AQUASTAT, the standing database of national water resources, withdrawals and irrigated area. The denominator behind most figures on this site. fao.org
- Smart Water Magazine, the trade record for conveyance, storage and treatment awards across the region. smartwatermagazine.com
Sources
31 references
- Armon, M. et al. (2025), “Anatomy of a foreseeable disaster: lessons from the 2023 dam-breaching flood in Derna, Libya”, Science Advances, full text via PubMed Central.
- LDK Consultants for the EU-funded WES programme (2024), Non-revenue water policy for Jordan.
- World Bank (2023), Jordan Water Sector Efficiency Program (P176619), appraisal-stage project information document.
- World Bank (2023), Baghdad Water Supply and Sewerage Improvement Project (P162094), restructuring paper.
- Sharakat (Saudi Water Partnership Company), 7 Year Statement 2025–2031, March 2026.
- AGBI, “Libya prepares final phase for giant man-made river”, December 2024.
- EBRD and the Ministry of Water and Irrigation of Jordan (2025), Aqaba-Amman water desalination and conveyance project, environmental and social impact assessment: non-technical summary.
- United Nations in Iraq, “Rain brief: recent rainfall and water situation in Iraq”, 5 June 2026.
- Smart Water Magazine, “Vision International Investment Company named preferred bidder”, 26 December 2025.
- Smart Water Magazine, “PowerChina subsidiary wins $1.32 billion contract for Iraq desalination pipeline”.
- Iraq Business News, “Work starts at major seawater desalination project in Basra”, 26 July 2025.
- MEED, the Disi water conveyance project.
- AFP via Phys.org, “Morocco’s water highway averts crisis in big cities”, March 2025.
- La Presse de Tunisie, “Grand Sfax: les pertes d’eau chutent de 50% à 26%”, 24 April 2026.
- L’Économiste Maghrébin, “25% de l’eau potable perdue dans des réseaux vieillissants”, 6 August 2026.
- Radio Algérienne, report on SEAAL’s leak repairs and water saved in 2024.
- Oman Observer, “Nama Water operates 1.41m m³/day capacity”, 16 December 2025.
- The Peninsula, “Kahramaa’s water reserves increase many folds”, 16 March 2025.
- Gulf News, “Dubai’s water losses among the lowest in the world”, 6 January 2019.
- The Daily Tribune (Bahrain), “EWA sets 23% water loss target by 2032 under updated plan”.
- Daily Sabah, “Türkiye advances water infrastructure to meet cities’ needs by 2050”, August 2025.
- Smart Water Magazine, “Turkey unveils national water plan”, 25 March 2026.
- Supreme Standing Committee for Human Rights (Egypt), Egypt’s national efforts to provide and ensure water availability, 22 March 2025.
- Palestinian Water Authority, Non-revenue water reduction strategy.
- Talozi, S., Al-Kebsi, A. and Klassert, C. (2025), “Energy for water and food: Jordan’s main water conveyance system between 2015 and 2050”, Water 17(10):1496, doi:10.3390/w17101496.
- European Federation of Foundation Contractors, “Trevi Spa awarded Mosul Dam project contract in Iraq”.
- FAO, AQUASTAT — Global Information System on Water and Agriculture: country water resources, withdrawals by sector and dam register. fao.org/aquastat. Latest country values as compiled at build.
- World Bank, World Development Indicators and country water-sector reporting. data.worldbank.org.
- Kaufmann & Kraay, Worldwide Governance Indicators (World Bank), 2024 update — political-stability and regulatory-quality scores, 0–100, shown in the market snapshot. worldbank.org/wgi.
- World Resources Institute, Aqueduct 4.0 Water Risk Atlas (2023) — the sub-basin risk, stress and groundwater-decline layers on the interactive maps. wri.org/aqueduct.
- MENA Water Review major projects register and PPP pipeline — compiled from procurer publications, development-bank project pages and trade reporting; each record names its source.
Numbered references are linked from the superscript markers in the text. Figures without a marker come from the sources above as compiled in the site methodology.
Latest intelligence
Partnership
Partner with the Dams, Storage & Conveyance hub
One organisation can sponsor this hub: your name and logo on the page, a profile in the organization directory, and first sight of the research we publish here. We take one partner per hub and we say who they are.